Education
How Can We Amplify Education as an Engine of Mobility?
Using big data to help children get the most from school

Education is a potent pathway to success, especially for children from disadvantaged backgrounds. But large gaps remain between different groups of students – in school quality, academic progression, and ultimately educational attainment. How can policies be crafted to address these issues so that education offers opportunity for all?
At Opportunity Insights, we use big data to study the role of education in helping children achieve the American Dream. Our research covers pre-school through post-secondary education, focusing on the effects of policies on students’ long-term outcomes.
Click here for Our Papers on Education
Key Findings
The famous Tennessee STAR experiment randomized students into different classrooms in Kindergarten through 3rd grade. Tests scores went up for a few years, but by 4th grade there was no difference. So did these classrooms matter in the long run?
We studied the long-term outcomes of these students and found an unambiguous answer: yes. Better classrooms, even for students as young as 5, had large impacts on college attendance, earnings, and even the fraction of girls who had children as teenagers. Medium-run test scores give a misleading picture, perhaps because better classrooms have persistent effects on children’s non-cognitive skills.
Many educations reformers advocate for measuring teacher quality based on student test scores, often called “value-added.” But how can we know whether this accurately measures the effects of teachers on student learning, or whether it just reflects the types of students a teacher happens to have in class?
We studied 2.5 million students and more than 18 million test scores to show that value-added measures do, in fact, measure the effects of teachers on students. We did so by looking at teachers who switched into and out of grades and subjects. When a great teachers arrives, test scores jump up (and stay high); when a great teacher leaves, we see the reverse.

Students taught for a single year by a great teacher (in the top 5% of the distribution of teacher value-added) instead of an average teacher earn $50,000 more over the course of their careers. This adds up to an increase in future earnings of $1.4 million for an entire class taught by a high quality teacher. Students taught by high quality teachers are also more likely to go to college, live in better neighborhoods, save more for retirement, and, for female students, are less likely to have children as teenagers.
Children with parents in the top 1% of the income distribution are 77 times more likely to attend an elite colleges and universities than children with parents in the bottom 20% of the income distribution. At many Ivy League and other highly selective schools, there are the same number of students from the top 0.1% of the income distribution (families earning more than $2 million annually) as from the bottom 20% of the income distribution (families earning less than $25,000 annually).
Nationally, children from the poorest families are substantially less likely than their peers from richer backgrounds to reach the top of the income distribution. But comparing two students at the same college, this difference almost entirely disappears – a finding that is especially true at highly selective colleges. This suggests that low-income students are not “mismatched” at these elite institutions and that increasing the number of students on campus from such backgrounds could be a powerful policy to expand opportunity.
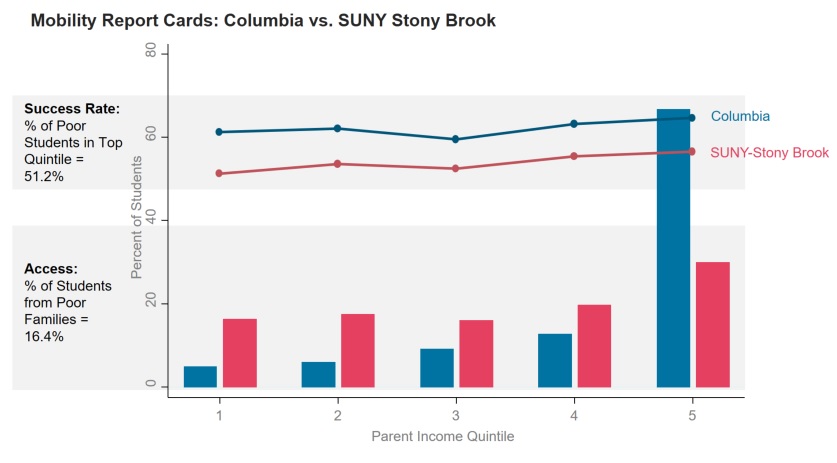
The mobility rate – the fraction of students that both come from poor backgrounds and achieve economic success – varies greatly across institutions. Elite schools have relatively few low-income students on campus, but those students are very likely to succeed economically. Conversely, community colleges serve many more students from poor backgrounds, but their outcomes are on average lower. Despite this apparent trade-off between access and success, some colleges outperform on both dimensions. You can see a list of the highest mobility schools nationally here. Our on-going research seeks to learn from schools with high mobility rates this to improve mobility rates at all schools.
Despite the relatively small number of low-income students attending their schools, certain elite institutions, including UC-Berkeley, Columbia, and MIT, propel more students from poor backgrounds into the very top of the income distribution than their peer institutions. As a result, these institutions are helping create a diverse group of leaders for the next generation.
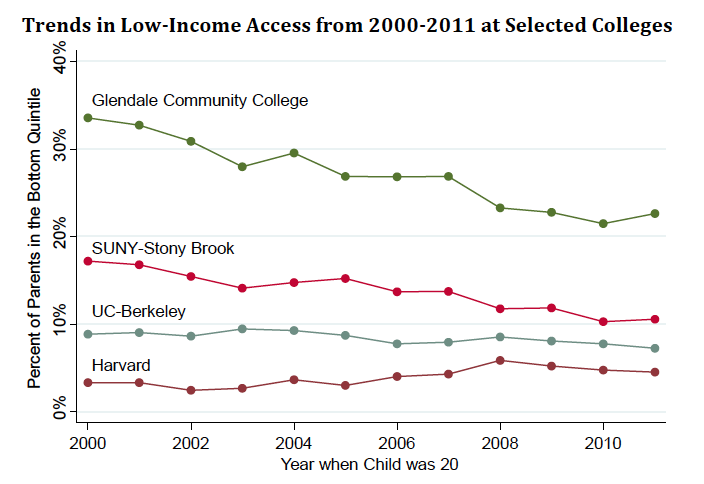
- Over the past 15 years, the college attendance rate for students from poor backgrounds has risen faster than for any other group of students. But despite this growth in access to higher education more broadly, the fraction of low-income students at high-mobility colleges has fallen. The number of low-income students has also risen only slightly at elite schools, despite expanded financial aid packages and recruitment efforts at many of these institutions.
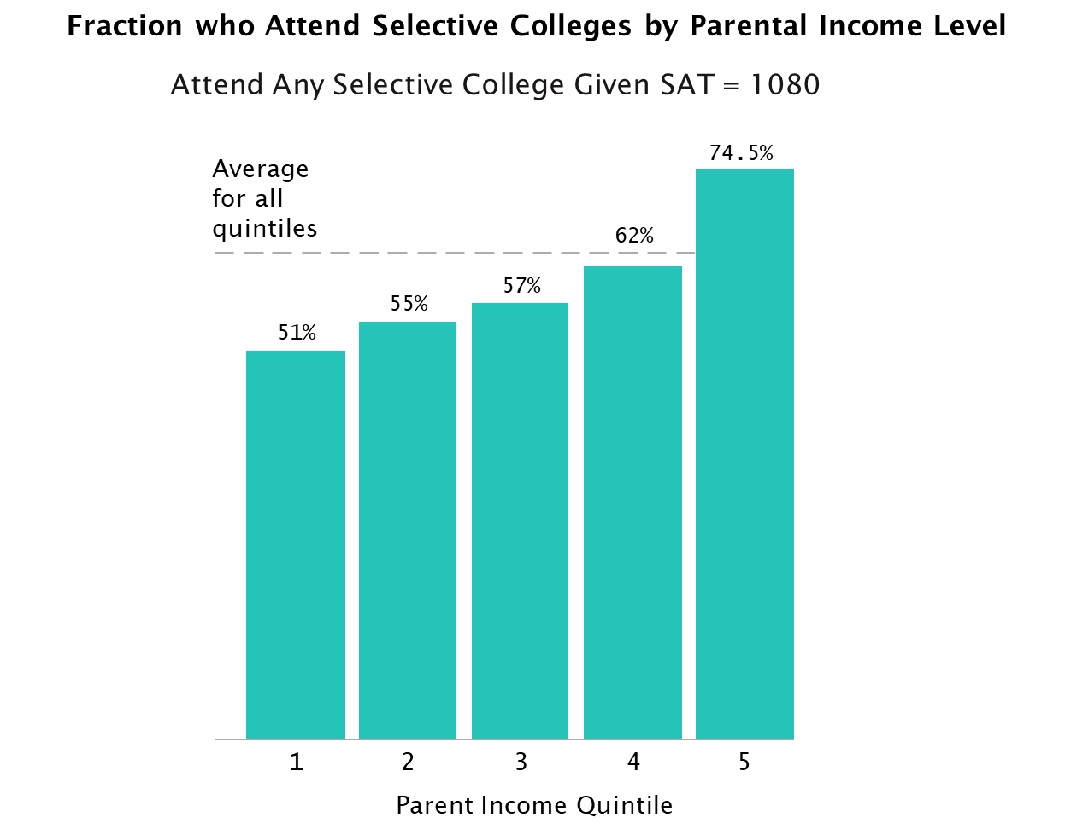
The figure shows the fraction of students by parental income quintile who attend selective (i.e., non-open-enrollment) colleges, among students who have an SAT score of exactly 1080 (the median score among students who attend selective colleges). Children from lower-income families are under-represented relative to children from high-income families despite having the same test scores.
Building on this simple result, we quantify how much of the parental income differences we see across colleges can be explained by pre-college differences in preparation and achievement. To do so, we construct a hypothetical “income-neutral” student allocation process in which students with comparable SAT/ACT scores attend each college at the same rate, irrespective of their parents’ incomes. Intuitively, if all students at a given college had an SAT score of 1080, then this counterfactual would simply be the parental income distribution of students with a test score of 1080. In practice, since students’ SAT scores vary within a given college, we take an average of the parental income distribution in proportion to the frequency of students with each SAT score in each college. We further hold the distributions of home state and the racial composition at each college fixed. The resulting hypothetical student allocation provides a natural benchmark to gauge the extent to which student bodies are representative of the underlying pool of academically qualified students.
We find that economic diversity at selective schools would rise significantly if students attended colleges in an income-neutral manner, holding their test scores fixed. The fraction of students from the bottom parent income quintile would rise from 7.3% to 8.6% at selective colleges (Figure 2). Since 10.7% of all college students in the US come from bottom-quintile families, this scenario would close one-third of the gap relative to what one would expect if attendance patterns were completely unrelated to parent income. The representation of middle-class students would also rise significantly across selective colleges.

This figure shows how the fraction of students who attend elite private colleges (the Ivy-League plus Chicago, Duke, MIT, and Stanford) varies with parental income, among students who scored exactly a 1400 on the SAT (the median score among Ivy-Plus students). We find that middle-class students are especially underrepresented at Ivy-plus colleges (a “missing middle”). Under the income-neutral benchmark, the fraction of students from the middle class (the 2nd, 3rd, and 4th parent income quintiles) would rise by more than one-third, from 28% to 38%.
Perhaps surprisingly, students from the lowest income (bottom quintile) families are only slightly under-represented at elite private colleges. The fraction of students from the poorest parent income quintile would only increase from 3.8% to 4.4% under an income-neutral benchmark. This is because there are unfortunately relatively few students from low-income families who have sufficiently high SAT/ACT scores to be admitted to Ivy-Plus institutions. Prior research suggests that children from low-income families have fallen behind by the end of high school in large part because of disparities in schools, neighborhoods, and other environmental factors that cumulate since birth.
Further increasing the fraction of low-income students at selective colleges beyond the income-neutral benchmark would require policies that induce low-income students to attend highly selective colleges at higher rates than higher-income students with comparable test scores. This would require either better childhood environments that improve pre-college credentials or changes to the application and admissions process.
If low-income students attended colleges comparable to high-income students with 160-point higher SAT scores (on the 1600-point scale), the fraction of low-income students would be roughly similar across all college selectivity tiers, including the Ivy-Plus tier, as shown in Figure 2. For instance, the fraction of bottom-quintile students in the Ivy-Plus would rise to 11.8% — similar to that currently at community colleges — and the fraction of students from the bottom 60% of parent incomes (roughly equivalent to the Pell share) would rise to 44.5%.
What would such a scenario entail in practice? At Ivy-plus institutions, it would mostly require increasing attendance rates for low-income students whose scores already put them in a plausible range for admission. For instance, in our data, just 7.3% of low-income students scoring a 1400 on the SAT currently attend Ivy-plus colleges; our need-affirmative scenario would raise the Ivy-plus attendance rate for these students to 25.8%. This increment is very similar in magnitude to the preference in admissions given to legacy students, recruited athletes, and underrepresented minorities at elite colleges, who are admitted at higher rates than other students with similar qualifications.
What does this mean for policy?
Our results suggest that there are a number of ways in which we can improve the quality of education – and access to it – from Kindergarten to career.
For instance, we must improve students’ access to higher education, especially at selective schools. There are too many schools that have low-income students who achieve impressive outcomes, but who admit relatively few low-income students.
Policy must be also focused on finding ways to improve the success of students once they arrive on campus. Schools that low-income students attend too often do not support them to get the most from the opportunities available to them, leaving them without the skills they need to reach the middle class.
Studying high-mobility institutions – those schools that admit large numbers of low-income students and whose low-income students achieve economic success – in detail can help us in both of these challenges. But we must also seek to provide answers to local problems, rather than imposing “one-size-fits-all” national solutions. To bring big data to bear on these issues, we formed the CLIMB Initiative
Collegiate Leaders in Increasing Mobility (CLIMB)

The CLIMB Initiative is a partnership between leading higher education economists and a diverse set of U.S. colleges and universities. Through CLIMB, we seek to understand not only which colleges act as engines of intergenerational mobility, but why, and how schools and policymakers can promote opportunity and economic growth by helping larger numbers of students from disadvantaged backgrounds succeed. By harnessing the power of big data, we can not only understand what works generally, but also how to adapt policy for different types of students across a wide range of schools.
Our partner institutions enroll more than 1 million students at four-year schools and another 2.4 million students at community colleges, representing more than 15% of the entire US undergraduate populations at degree-seeking institutions.
Along with our partners, the CLIMB Initiative seeks to answer three specific questions:
- How much of the variation in mobility rates across schools is due to aspects of the schools themselves, compared to other factors, such as geography or academic focus?
- How can schools find more qualified students from disadvantaged backgrounds to expand access, rather than institutions targeting the same set of qualified students?
- What successful programs and pathways do schools already use to support student success, and how can we target the best specific mix of programs for each student?
To learn more about our work in the CLIMB Initiative, or to inquire about joining the CLIMB partnership, click here.