
We use administrative records on the incomes of more than 40 million children and their parents to describe three features of intergenerational mobility in the United States.
First, we characterize the joint distribution of parent and child income at the national level. The conditional expectation of child income given parent income is linear in percentile ranks. On average, a 10 percentile increase in parent income is associated with a 3.4 percentile increase in a child’s income.
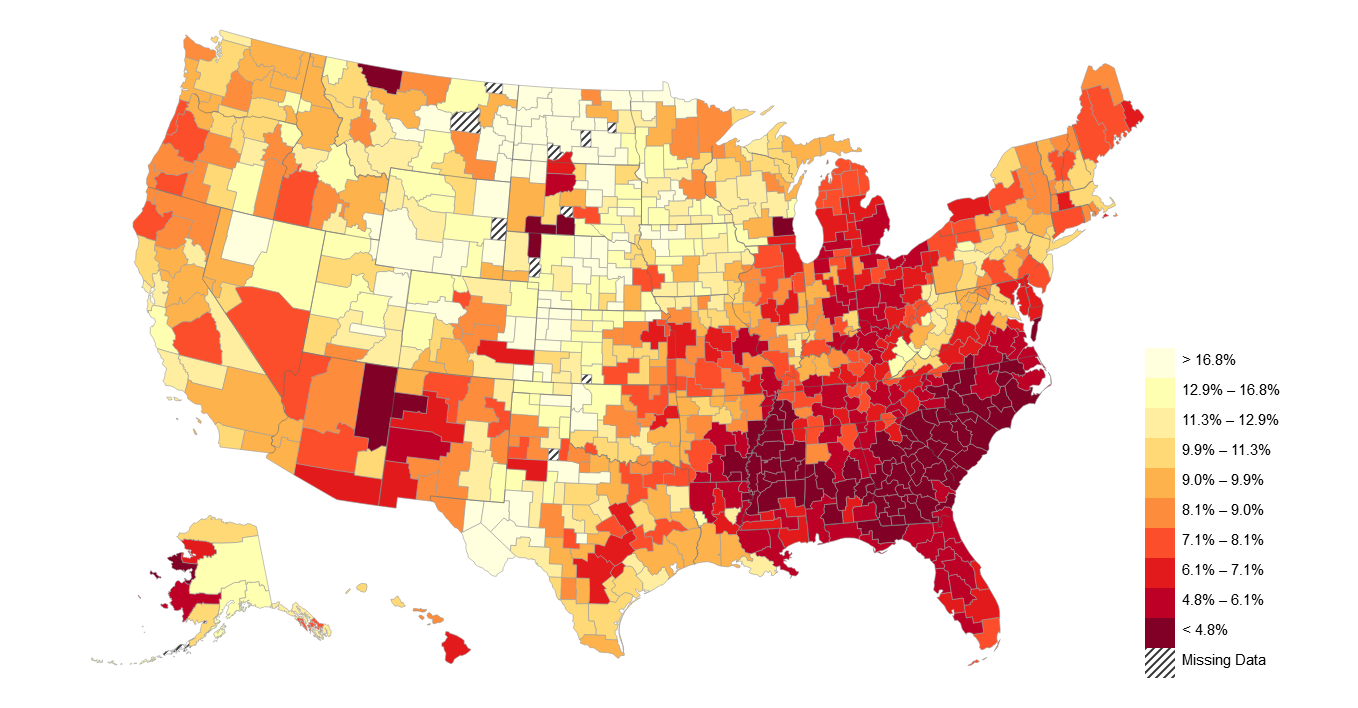
Second, intergenerational mobility varies substantially across areas within the U.S. For example, the probability that a child reaches the top quintile of the national income distribution starting from a family in the bottom quintile is 4.4% in Charlotte but 12.9% in San Jose.
Third, we explore the factors correlated with upward mobility. High mobility areas have (1) less residential segregation, (2) less income inequality, (3) better primary schools, (4) greater social capital, and (5) greater family stability. While our descriptive analysis does not identify the causal mechanisms that determine upward mobility, the publicly available statistics on intergenerational mobility developed here can facilitate research on such mechanisms.
The opinions expressed in this paper are those of the authors alone and do not necessarily reflect the views of the Internal Revenue Service or the U.S. Treasury Department. This work is a component of a larger project examining the effects of tax expenditures on the budget deficit and economic activity. All results based on tax data in this paper are constructed using statistics originally reported in the SOI Working Paper “The Economic Impacts of Tax Expenditures: Evidence from Spatial Variation across the U.S.,” approved under IRS contract TIRNO-12-P-00374 and presented at the National Tax Association meeting on November 22, 2013.